Angles and Algorithms: Recreating xG
Over the past decade, xG has become the most ubiquitous, and in many ways overused, advanced statistic in football. This page will attempt to take us back to step 1, understanding the basics of the math behind models such as xG, as well as showing interactively how the function itself behaves on a football pitch.
About xG
xG or Expected Goals, is derived from the concept of Expected Value in statistics. It is the probability that a chance will be scored, based on a variety of different variables such as distance from goal, angle of shot, phase of play, type of shot (header, foot, penalty) and other possible measures such as defensive positioning and type of pass.

It's important to understand that because xG uses thousands of instances of shot data to curate its model, we interpret it with respect to its means of calculation.
Recall that the Law of Large Numbers tells us that as we take the average of a sample if infinite iid random variables, this sample mean will approach the true mean (or Expected Value).
Take, for example a shot inside the penalty area with an xG of 0.6. While we would intuitively expect 60% of the efforts from this exact spot to be goals, there may be instances in the short term where certain players overachieve or underachieve this value, and the real goal ratio is not equal to this value. What we are assuming with our xG value, is that over the course of a season, the real ratio will converge to this 0.6 value. Of course certain random variables, or players in the context of this problem, will over and underachieve, but this is the exact variation that exists in something like a coin toss that converges to its true mean.
We can even extract information from instances in which small scale performance deviates strongly from the model's expectation. Is it a fluke season? Is the player a great finisher? Is his team creating high quality chances? These are all important questions that may not be answered directly with xG, but can lead analysts and statisticians to the right direction.
The Model
In this particular model, we are pulling event data from the 2017-2018 season for the top 5 European Leagues (England, Spain, Italy, Germany, France). We're using the distance from goal, the angle created with the goal, and whether or not the shot was a header to create a model that will give us a likelihood of a shot being a goal.
The data comes from a WyScout event data sample set available to the public. It's organized as a .json with hundreds of events per game (shots, dribbles, fouls, saves, etc).

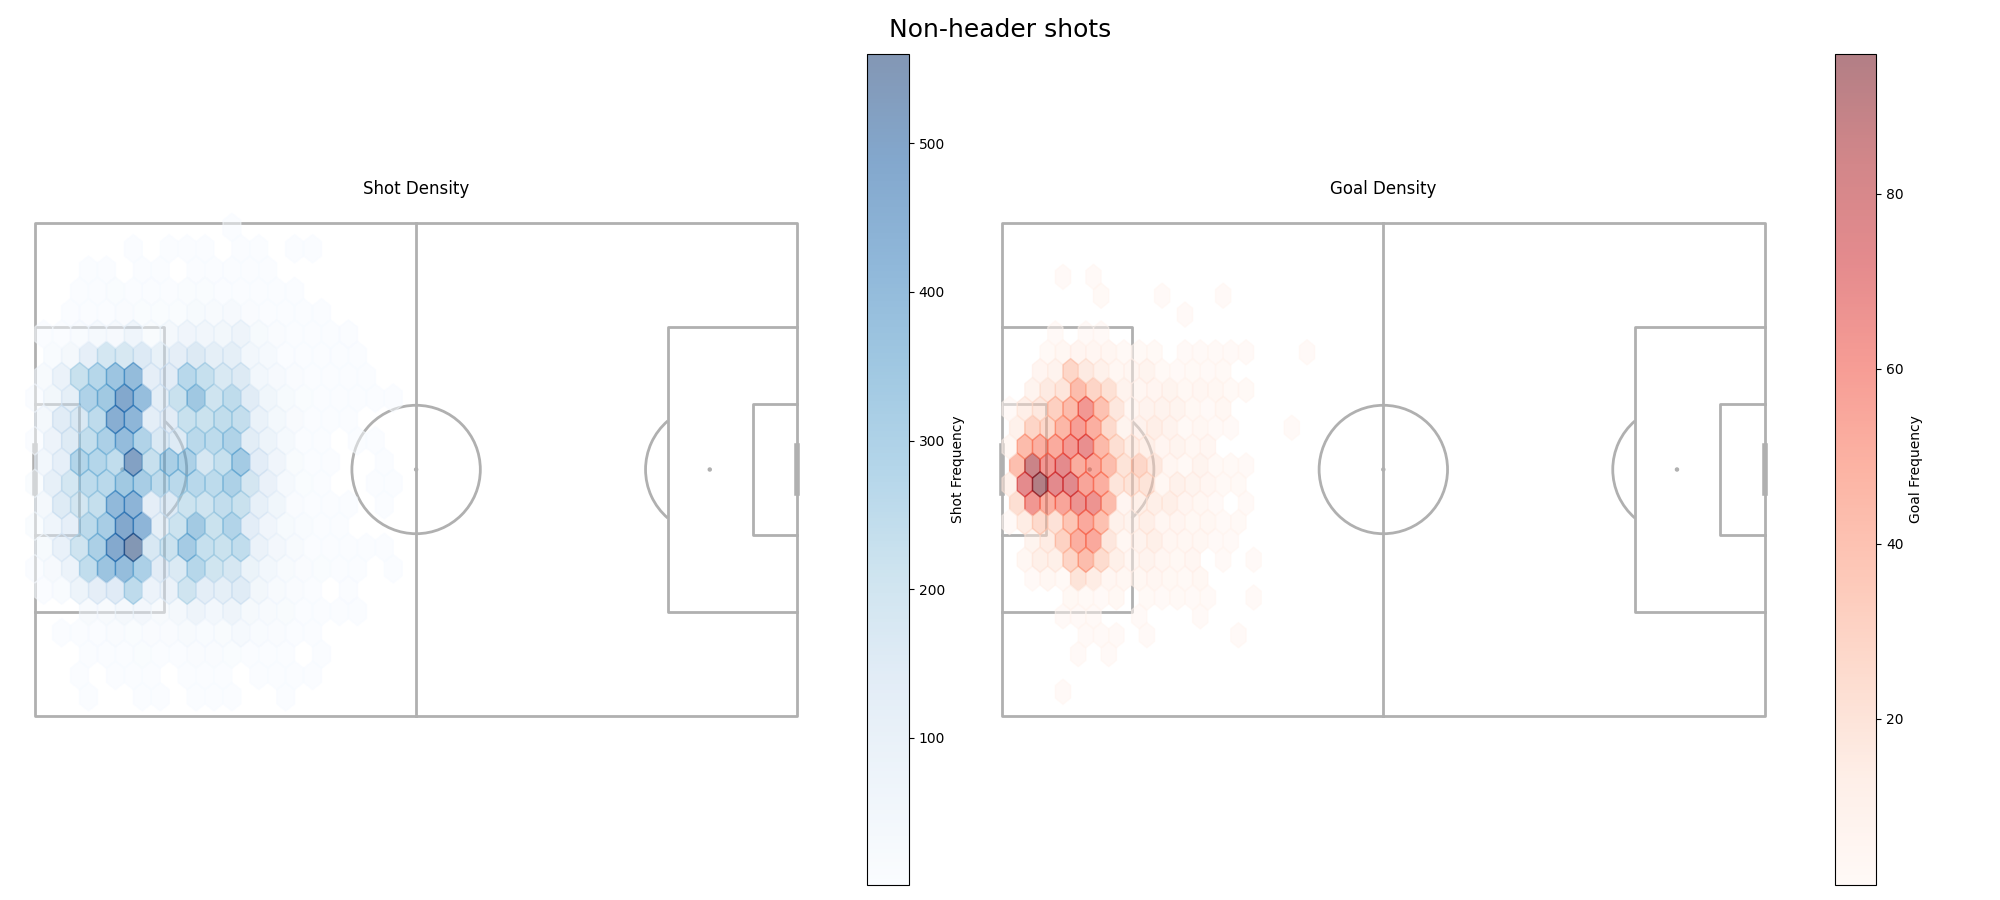
Notice how low the goal density is for shots outside of the 16 yard box relative to the amount of shots that are taken from those distances. If you watch football often, think about the best teams in the world, and how often they take these sort of chances. Has it increased or decreased in the past 10 years?
.png)
.png)
We can clearly see that there exists some form of an exponential relationship between the distance variable and the probability of scoring a goal. More precisely, scoring a goal becomes exponentially more difficult as we move away from the goal.
For the angle, the relationship is a bit more predictable. We see a roughly linear relationship up to a certain point (about 100 degrees), until we observe a erratic up and down of probabilities. This is likely due to the fact that chances from this close rarely occur, and there isn't enough data to have these values regress to where they would likely lie on this hypothetical curve.
For a detailed breakdown on the xG model and how I created it, head over to my GitHub, where I explain in more detail the process of developing the model, as well as other visualizations that I spared from this page.
Interactive Pitch
Since our model reflects real positions on a football pitch, we can map the model onto a field in order to observe how exactly xG behaves in certain places. Shots that you might normally think are clear cut chances do not always have such high probabilities of being a goal.
Assume we are attacking the goal on the right. Hover your mouse over the pitch to see how the distance, angle, and xG all change relative to where the mouse is located.
To adjust for shots that are headers, check and uncheck the button above the pitch.
Using xG Effectively
More often than not, xG is interpreted in a vaccum. That is, it's considered on a small scale of one or a few games, when in reality it is most useful as a statistic that is used over the course of a season. It's a metric that can not only provide insights into the ability of certain players to finish their chances, but also detect quality of chance creation based on consistent over or underperformance.
Here, we can take a look at how teams performed throughout the duration of the 2022-23 season vs their respective expected goals. In this context, we can more confidently say that instead of all of, for example, Arsenal's players overperforming on finishing, it's very likely that the quality of chances that Arsenal creates were underpredicted by the Premier League's model. This kind of variation is completely normal, after all, there exists a relative symmetry between the overperforming and underperforming goals scored, which is the type of variation we would expect in a model that is trying to map something inherently random.
Moving Forward
Realistically speaking, there are a plethora of other variables that are incredibly relevant to the goalscoring process that we haven't put in our model, and would likely improve it. Things like pass type (through ball, cross, backpass) or chance type (1 on 1, free kick, penalty) could vastly affect the way in which the model calculates the xG; and that's before taking more elaborate metrics into account such as defensive positioning and phase of play.
There are billions of dollars circulating at the highest level of football. Scouts, independent analysts, bookies, and football clubs themselves all understand that the more detailed their initial data is, the more accurate their models will end up. This can make it difficult to find event data that is both free and extensive, as data providers understand the value of what they are providing. For those interested in replicating an xG model like this, or create something else entirely, take a look at the dataset provided here.


